Hourly Retrieval of Aerosol Optical Thickness from MSG/SEVIRI Observations with the CISAR Algorithm
In the context of the ESA Aerosol_cci project, the Combined Inversion of Surface and AeRosol (CISAR) algorithm has been applied to MSG/SEVIRI observations to deliver the aerosol optical thickness at 0.55μm, the associated uncertainty and the fine mode fraction. These values are retrieved every hour for clear-sky pixels over both land and sea surfaces.
MSG/SEVIRI observations acquired in bands 0.6μm, 0.8μm and 1.6μm are accumulated during a period of five days. During that period, surface properties, represented by the RPV model ( Rahman et al., 1993) over land, are assumed invariant. Over sea, surface reflectance is calculated with the Cox-Munk model as a function of the wind speed.
MSG/SEVIRI observations are then screened out for clouds using the Now Casting SAF cloud mask (Derrien and Le Gleau, 2005) retrieved from the Climate SAF archive. The radiometric noise for every pixel is estimated with the method proposed by Govaerts et al. (2010). In order to reduce the amount of processed data, only one observation out of the four available every hour is kept for the retrieval. Only pixels with an illumination and viewing angle smaller than 70° are processed.
The CISAR algorithm retrieves the aerosol single scattering properties from the mixture of fine mode absorbing and non absorbing particles and a coarse mode composed of large particles (Govaerts and Luffarelli, 2018). Small atmospheric particles usualy result from anthropogenic activities while large particles are due to natural emission in most of the cases.
Prior information on the surface reflectance is taken from the previous accumulation period as the surface radiative properties are not supposed to change rapidly on a short time scale at SEVIRI spatial resolution. The associated uncertainty is estimated analysing the temporal variability over the last three months. When no information is available from the previous accumulation period due to persistent cloud cover or under illumination conditions, the prior information is taken from the last available retrieval, with an uncertainty that increases with time. Concerning aerosol optical thickness prior value, a very low optical thickness is assumed but with a very large uncertainty. Aerosol spectral and temporal smoothness constraints are also applied. No prior information is applied on the aerosol or surface property spatial variability.
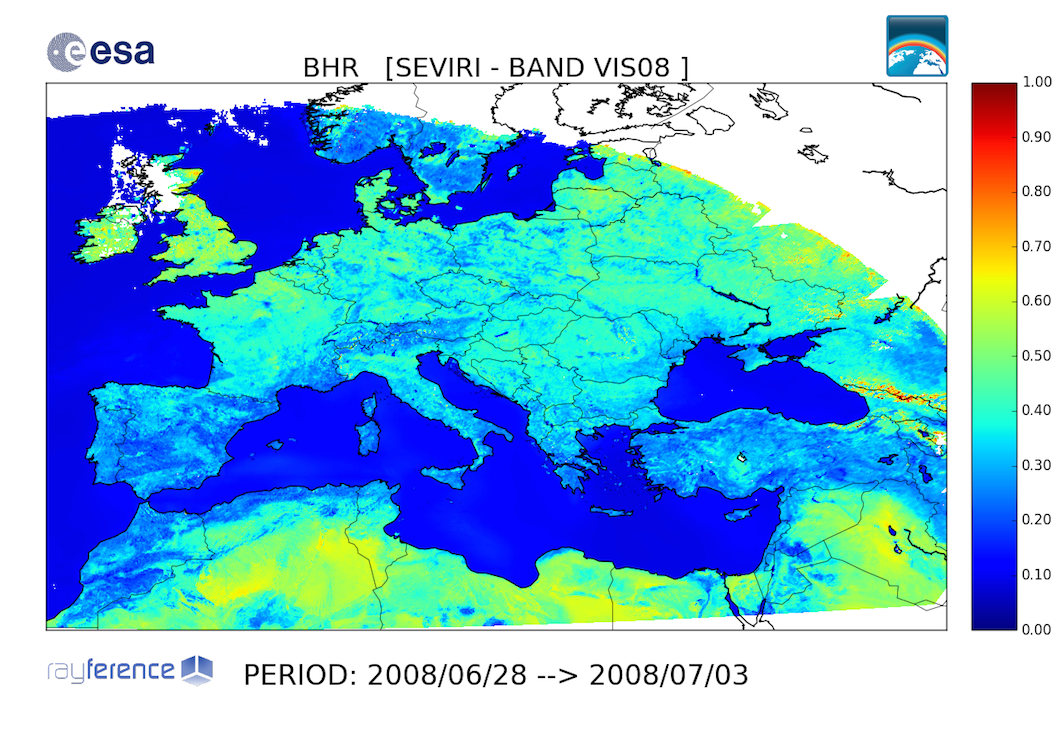
For each processed five-day time period, the CISAR algorithm provides the value of the retrieved surface reflectance model parameters and their uncertainty in each spectral band. From these values, the CISAR algorithm calculates the BiHermispherical Reflectance (BHR) under perfectly diffuse illumination conditions. CISAR also provides the aerosol optical thickness and associated uncertainty in each SEVIRI spectral band and the extrapolated value at 0.55μm.
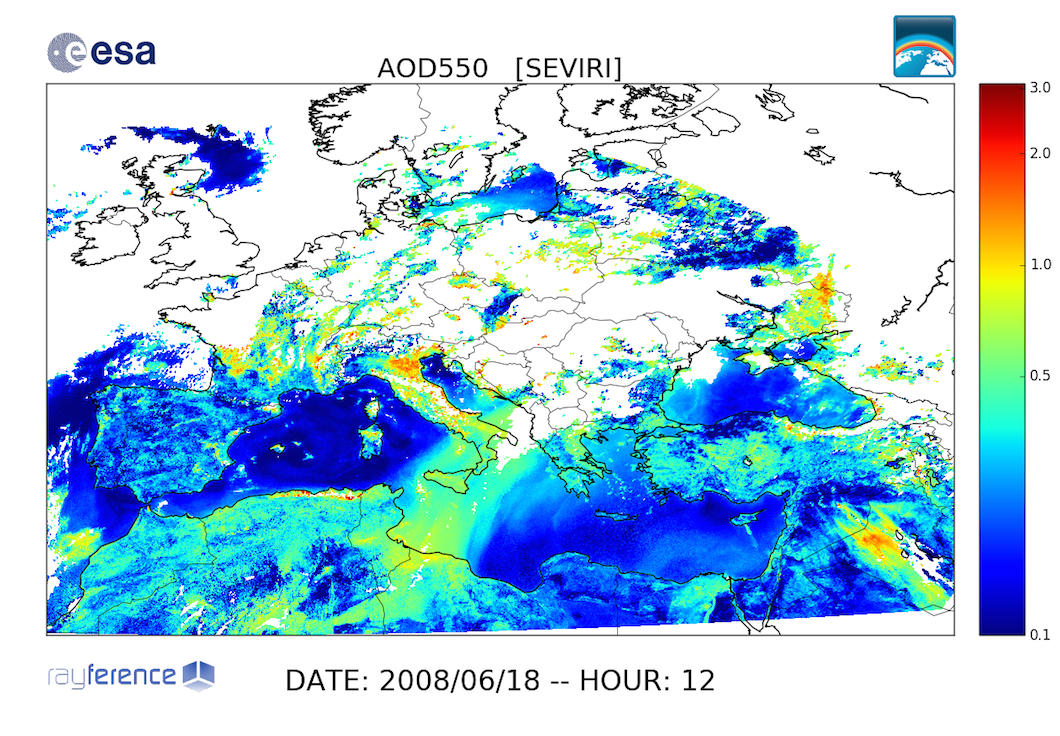
Figure (1) shows a sequence of hourly total column aerosol optical tickness derived from over Europe and the Mediterranean basin and Europe in June 2008. An example of derived BiHermispherical Reflectance (BHR) during that period is given in Figure (2).

The CISAR algorithm also retrieves the fine mode fraction. An example of such a retrieval is given in Figure (3). In this example, the dust storm crossing the Mediterranean sea from Libya toward Italy with optical thickness higher than 0.5 appears clearly as coarse particles.

A closer look at the results over the Ouargla region in Algeria during the 11-16 and 24-27 June 2008 period reveals emission of plumes, the temporal evolution of which can be monitored during the course of the day. Figures (4) and (5) illustrate the capability of the CISAR algorithm applied on SEVIRI data to identify emission plumes over bright surface. On these figures, only pixels with an aerosol optical thickness higher than 0.3 are displayed. The KML files used to generate the animation are availabe for download here.